TIA Gann Swing Indicator
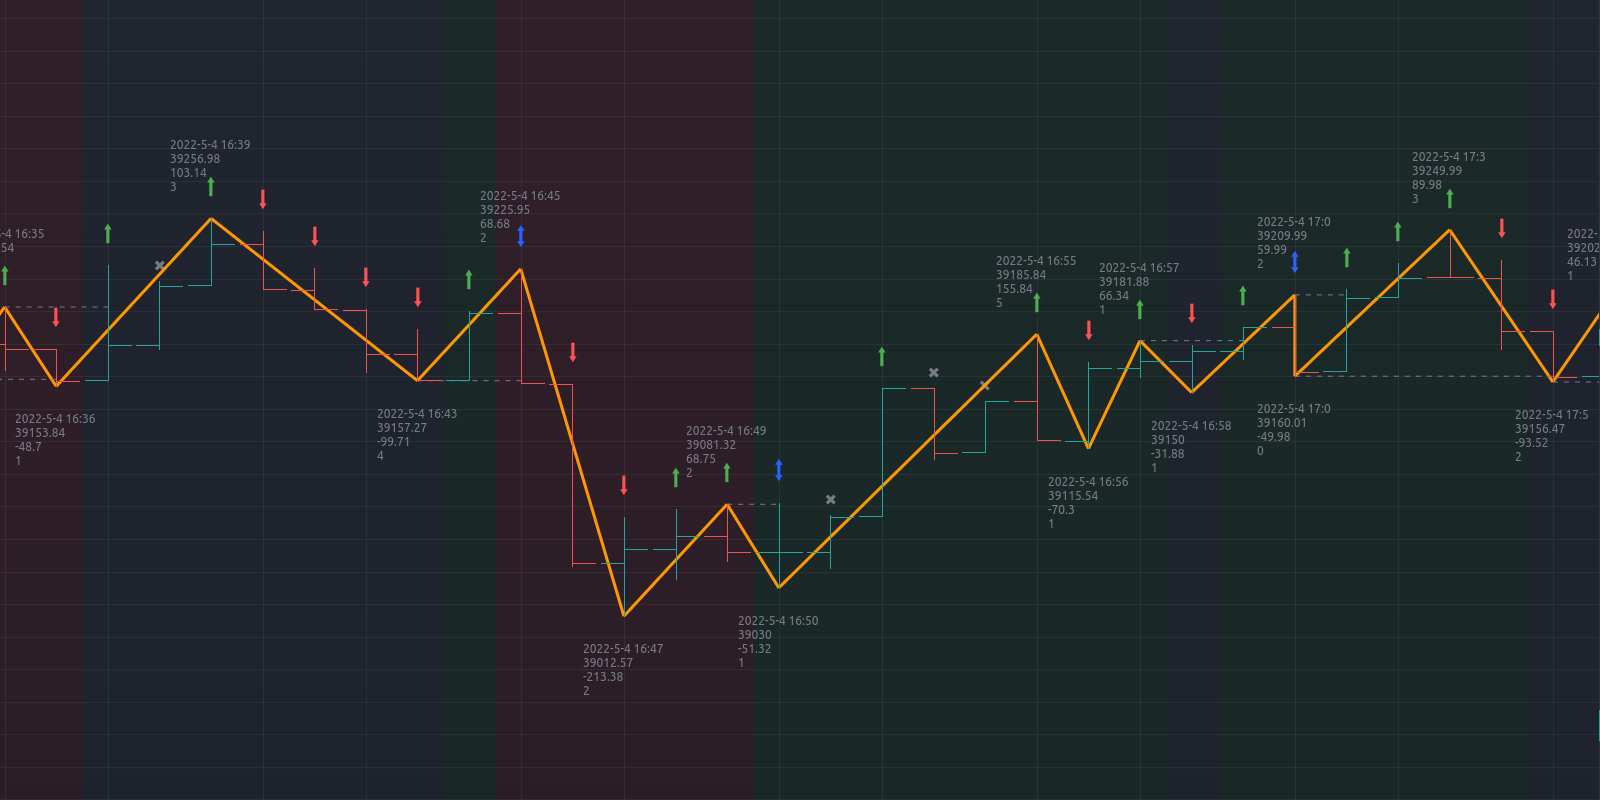
This indicator is a mechanical tool that tells the user exactly what the market trend is at any time, based on the teachings of Legendary trader, Mr. William D. Gann. He called this tool the "Trendline Indicator", but it has popularly become known as the "Swing Chart" by present-day traders.
In October 1909, Richard Wyckoff watched Gann for 25 market days (the markets traded on Saturdays back then), where Gann made 286 trades, both long and short. Two hundred sixty-four (264) of these trades were profits. The Swing Chart was Gann's primary trading tool helping him achieve these phenomenal trading results.
Are you ready?
You are entitled to a 7 days free trial before being charged for the full subscription.
You can cancel at any time before the trial ends and you will not be charged.
3 months
usd
59
total
usd 19.66 per month
Billed every 3 months

7 days free trial
-
Weekly market reports
-
Instant access to TIA Gann Swing Indicator
-
Lifetime access to our Indicator Suite
Best value
1 year
usd
179
total
usd 14.91 per month
|
You save 24%
Billed once a year
-
7 days free trial
-
Weekly market reports
-
Instant access to TIA Gann Swing Indicator
-
Lifetime access to our Indicator Suite
-
For Investors that want the best deal
6 months
usd
99
total
usd 16.50 per month
|
You save 16%
Billed every 6 months
-
7 days free trial
-
Weekly market reports
-
Instant access to TIA Gann Swing Indicator
-
Lifetime access to our Indicator Suite
-
For Investors that want a better deal
This is definitely one of the most profitable tools at your disposal. Because tools are only as good as our reasons and methods for using them we recommend checking the videos available on YouTube.
How to make the most money out of the market
Learn a trading strategy by Michael
Learn a trading strategy by Jason
For more information, we invite you to join the TIA Discord community and continue to the #tia-indicators channel, where you will find indicator-related help, tips, and tricks.
Subscribe to the TIA Gann Swing Indicator and get
LIFETIME ACCESS to the indicators below!
Subscribe to the
TIA Gann Swing Indicator
and get
LIFETIME ACCESS
to the indicators below!
Crypto Fear and Greed Index
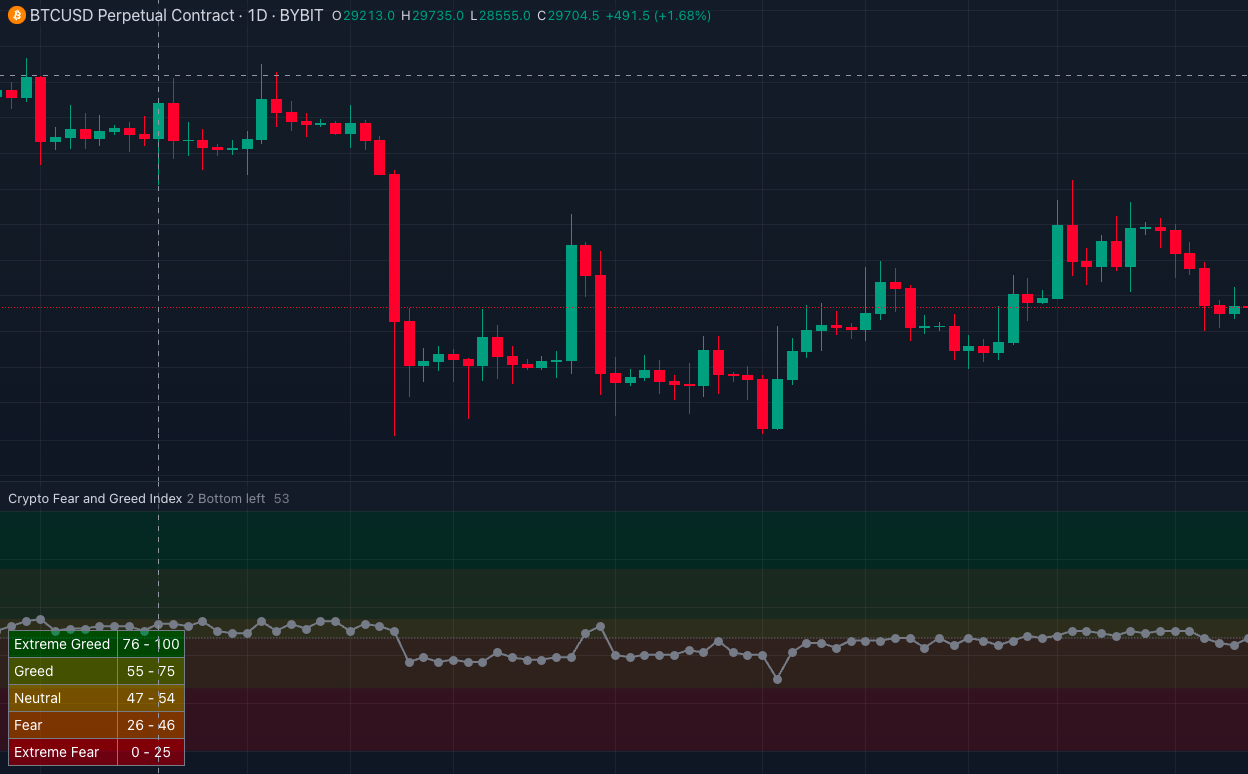
The crypto market behaviour is very emotional. People tend to get greedy when the market is rising which results in FOMO (Fear of missing out). Also, people often sell their coins in irrational reaction of seeing red numbers. With our Fear and Greed Index, we try to save you from your own emotional overreactions.
There are two simple assumptions:
- Extreme fear can be a sign that investors are too worried. That could be a buying opportunity.
- When Investors are getting too greedy, that means the market is due for a correction.
Therefore, we analyse the current sentiment of the Bitcoin market and crunch the numbers into a simple meter from 0 to 100. Zero means "Extreme Fear", while 100 means "Extreme Greed".
Crypto Fear and Greed Index reflects historical data provided by AlternativeMe.
To get Lifetime access to this indicator, subscribe to the Free The Investor Alpha Report. When subscribed, we will provide details on adding the Crypto Fear and Greed Index to your chart via email.
TIA Bitcoin Dominance
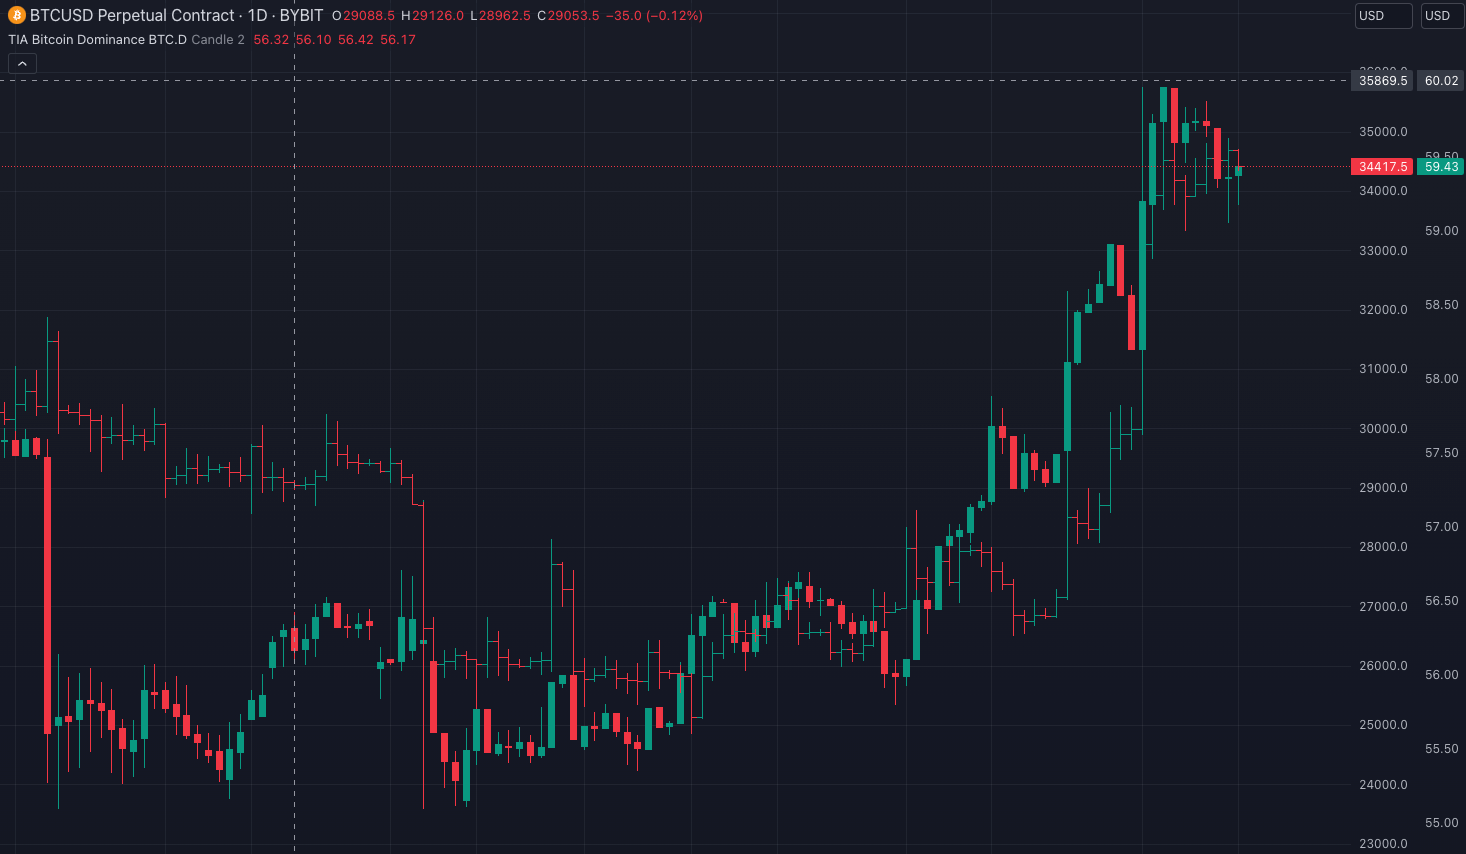
TIA Bitcoin Dominance indicator is a metric that helps to assess the relative strength of Bitcoin in the cryptocurrency market. It is calculated by taking the market capitalization of Bitcoin and dividing it by the total market capitalization of all cryptocurrencies with possibility to exclude Stable coins. This calculation gives us a percentage that represents the portion of the cryptocurrency market that Bitcoin holds.
By excluding stable coins from the calculation, we can get a more accurate picture of Bitcoin's dominance in the market. Including stable coins in the calculation would skew the results and make it harder to assess Bitcoin's true dominance.
Overall, the Bitcoin Dominance Indicator provides a useful tool for investors and traders to monitor the performance of Bitcoin in relation to the broader cryptocurrency market. By keeping an eye on Bitcoin's dominance, they can better understand market trends and make more informed investment decisions.
To get Lifetime access to this indicator, subscribe to the TIA Gann Swing Indicator. When subscribed, we will provide details on adding the TIA Bitcoin Dominance indicator to your chart via email.
TIA Crypto Total Market Cap
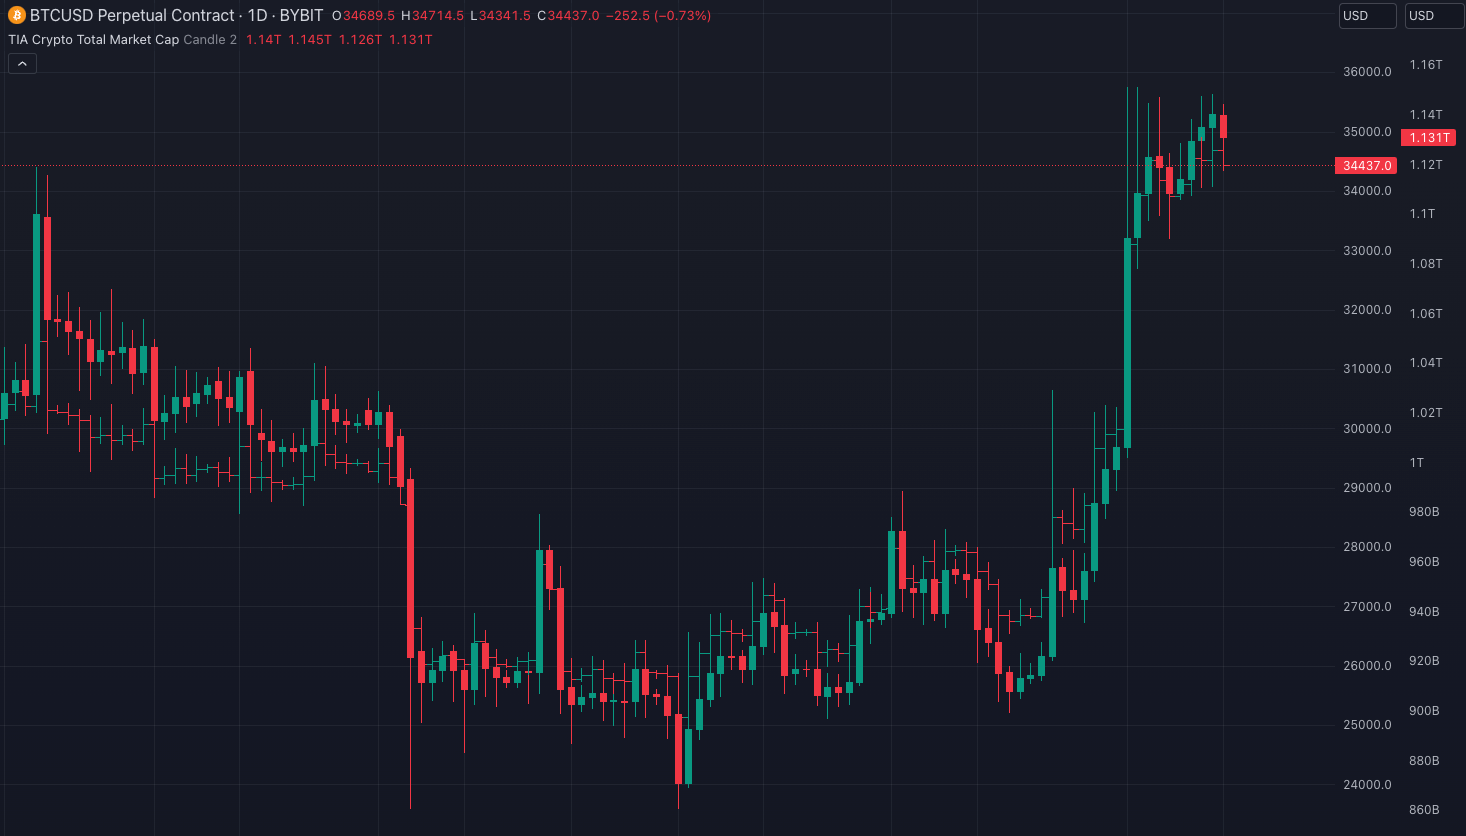
TIA Crypto Total Market Cap indicator is a metric that measures the total market capitalization of all cryptocurrencies in circulation.
This indicator offers a more comprehensive view of the cryptocurrency market beyond the dominant players, providing insights into the performance of other cryptocurrencies with possibility to exclude Stable coins, Bitcoin or Ethereum.
By excluding these three factors, the indicator offers a more balanced view of the broader cryptocurrency market and can be useful for investors, traders, and other market participants seeking to track trends and identify investment opportunities.
To get Lifetime access to this indicator, subscribe to the TIA Gann Swing Indicator. When subscribed, we will provide details on adding the TIA Crypto Total Market Cap indicator to your chart via email.
Frequently Asked Questions
What is TIA indicator subscription?
Subscribing to the TIA indicator means that you are subscribing to the indicator service available via the TradingView platform. Charges are executed in advance in intervals depending on the subscription plan. Unless explicitly stated on the product page, no money-back guarantee and no refund is available.
Do I need a paying TradingView account?
No, you can use a free TradingView account to subscribe to, and use TIA indicators in your chart.
How to change TradingView username for TIA indicator?
When you subscribe to the indicator you need to provide TradingView username to be used with the TIA indicator. You can change this username within 24 hours of configuring it for the first time. Go to your account page where you will see your current settings. If TradingView username change is possible, the Change button is visible below the currently configured TradingView username. Selecting this button will redirect you to the page where you can submit a new TradingView username. Please contact us if TradingView username change is not possible anymore, and we will do it for you manually.
How to cancel TIA indicator subscription?
You can cancel your subscription anytime by going to your account page where you will see the list of all your subscriptions. Then select the Manage button below the list, and you will be redirected to the page where you can cancel your subscription.
How to change TIA indicator payment options?
You can change TIA indicator payment options by going to your account page where you will see the list of all payment methods. Then select the Manage button below the list, and you will be redirected to the page where you can modify your payment options.
How to add TIA Indicator to your TradingView account?
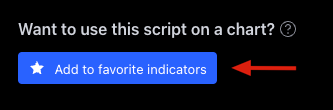
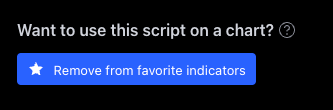
Follow to the
TradingView Add to favorite inicators Remove from favorite inicators
Now head back to the TradingView chart page and add the indicator to your chart. You should be able to find the indicator in your favorite indicators list and in your favorite indicators drop down menu.
TIA indicator access is restricted on TradingView?
!
Study Error
This script is invite only. To request access,
please contact its author.
Learn more
TIA indicators are accessible on subscription only unless stated otherwise on the product page. Please ensure you are subscribed to the indicator in question.
Sometimes you can experience this problem even when you are subscribed to the indicator. Usually, the problem is related to incorrectly entering TradingView username when subscribing to the indicator. Please ensure that the TradingView username you provided is yours and the one you are using with the indicator.
If everything checks out, the following steps were identified to help resolve this problem
- try to refresh TradingView page or,
- try to remove and re-add the indicator to the chart or,
- try to log out and back into TradingView.
TIA Gann Swing Indicator only goes back a few months?
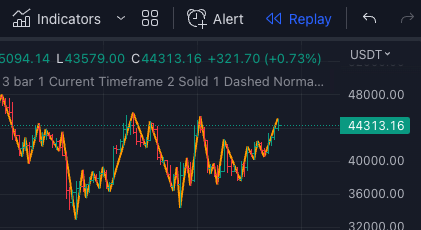
This is a TradingView limitation for all indicators. Framework limits the amount of lines indicators can draw on the chart, and for the time being, it is 500 lines.
To overcome this limitation while backtesting, you can always use the TradingView Replay feature and test it bar by bar at any time you wish. The indicator will draw 500 lines from that point back and update accordingly as you step the bars.
What if I need further assistance?
Please contact us if none of the information abowe helps resolving your problem. You can reach us via the TIA indicators dedicated email address [email protected] or by using the TIA main page contact form.