TIA Gann Swing Indicator
Customization
The TIA Gann Swing Indicator offers a lot of customization. Settings are divided into a number of sections, starting from the core swing overlay to multiple swing overlays, followed by advanced data.
Swing overlay
In this section we set rules for the swing chart including its visual parameters for the swing line.
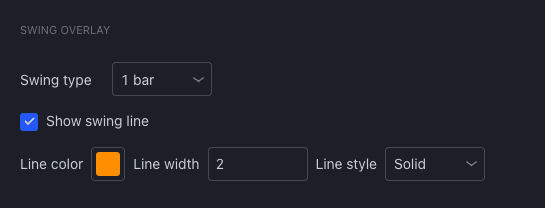
Swing type defines rules for swing creation. It defines how many up/down bars need to be counted for swing direction to be confirmed. 1 bar means just one up/down bar count. 2 bar means 2 bars up/down counted and 3 bar means 3 bar up/down bars counted for swing direction to be confirmed. The 1 bar swing type is the default setting and recommended setting.
More information about swing charting and swing trading can be found in TIA - The Investor Accelerator courses.
The Show swing line setting enables/disables visual representation of the swings. If it is disabled, swing tops/bottoms are still calculated behind the scenes but are not shown.
Swing overlay 2 & 3
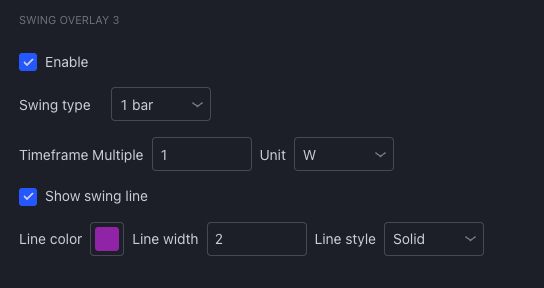
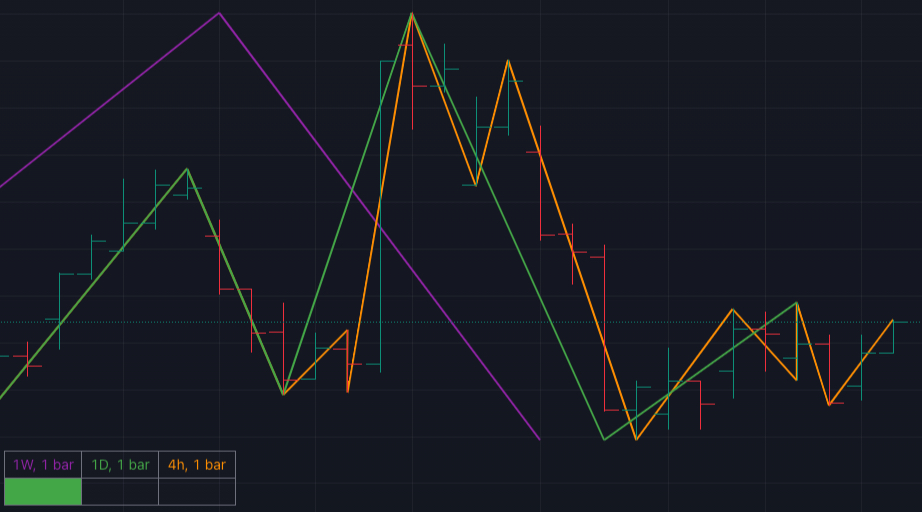
What makes this implementation of the swing indicator really powerful is the ability to layer additional swings on top of the currently chosen time frame. Doing so allows higher time frame trends to be shown on the one chart.
Example
Imagine our ideal timeframe is 4H. We can easily see the swings on higher time frames such as the 1D and 1W simultaneously. We can enable these additional swings by selecting Timeframe multiple and Unit.
For a 1D swing chart overlaying the 4H chart, select Timeframe Multiple 1 and the Unit as D (standing for Day).
For a 1W swing chart overlay overlaying the 4H AND 1D, select Timeframe Multiple 1and the Unit as W (standing for Week).
The additional Swing Overlay feature completely automates the swing charting processes removing the need to manually draw swings on the chart.
Being able to monitor multiple swing charts and trends simultaneously is a powerful tool providing valuable information regarding the underlying strength or weakness of the market. Monitoring and trading multiple timeframes identifying confluence between trends and direction is a strategy that has stood the test of time.

Example
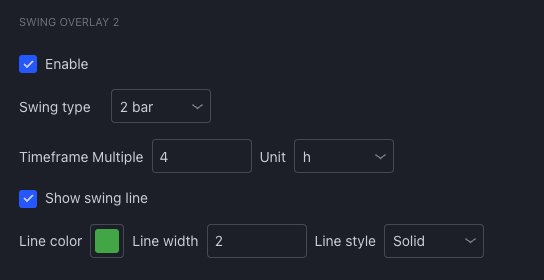
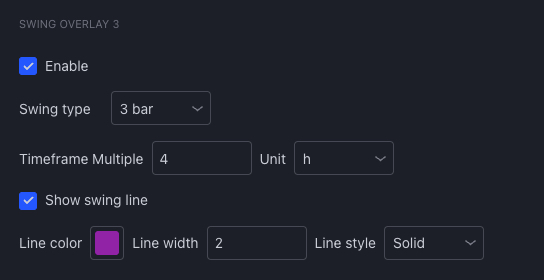
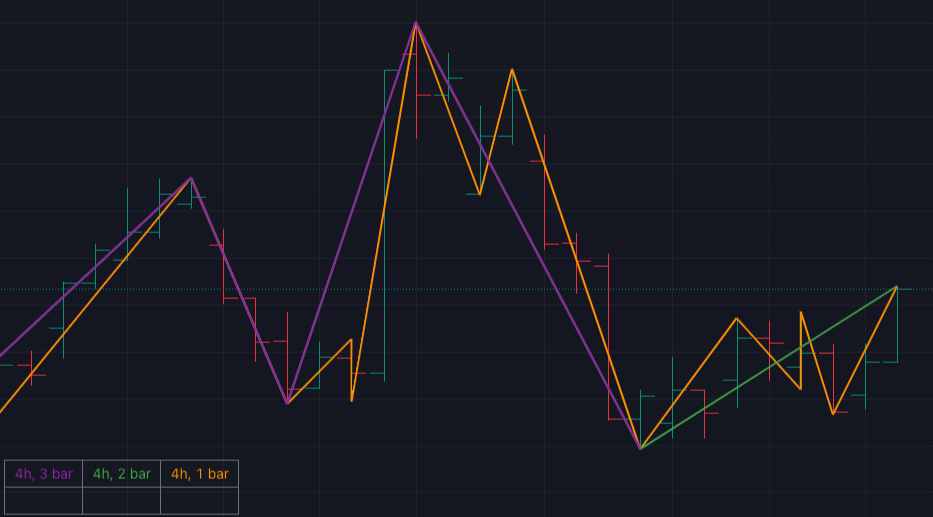
Imagine we selected a 4h time frame with 1 bar swing type, but we would also like to see 2 bar and 3 bar swing type on the same chart. We can enable additional swings with unit h, multiple 4 and swing type 2 bar and additional swings with unit h, multiple 4 and swing type 3 bar.
Additional swing overlays can be enabled, but with lines disabled. With these settings, additional swing tops/bottoms are still calculated behind the scenes, but are not shown on the chart.
This settings combination is usable when we don't want to see additional swing overlays, but still want to see their respective trends in the trend confluence table.
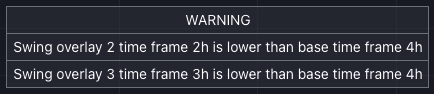
We can intermingle swing types and time frames as we choose. The limitation is available data, eg. weekly swing overlaid on 1 minute time frame, doesn't make sense and 1m time frame does not provide enough data. Second limitation is that we can enable additional swings only from current or higher time frames, but not the lower time frames. If this condition is not met, a warning message appears.
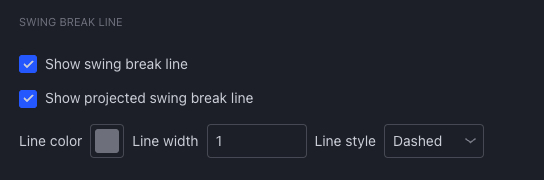
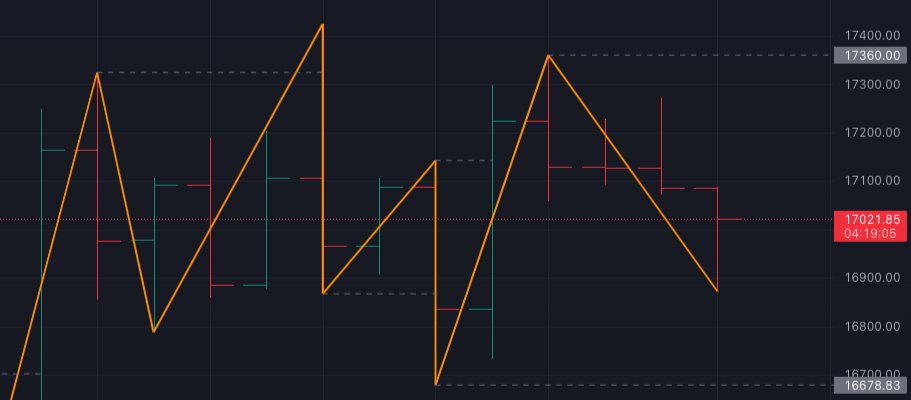
Swing break line
The settings in this section allows the user to plot swing breaks as well as project upcoming swing breaks.
Swing break line visually represents the level where the swing top/bottom was broken.
Projected swing break line projects the price levels of the last top/bottom and represents next levels of interest.
WD Gann (swing chart inventor) would buy/sell based on swing breaks (or multiple swing breaks) and also use previous swing tops and bottoms for stop placement. This setting helps identify past and potential levels.
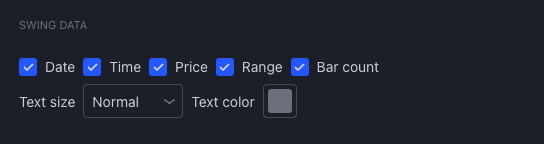
Swing data
These settings give the user additional data regarding swings and swing ranges (the distance from swing tops and bottoms). Advanced traders use this data for a deeper insight into market behaviour and volatility to anticipate future changes in price direction.
These settings include:
Date: This is the Date of the swing top/bottom creation.
Time: This is the Time of the swing top/bottom creation.
Price: This is the Price of the the swing top/bottom.
Range: This shows the price difference between swing top/bottom.
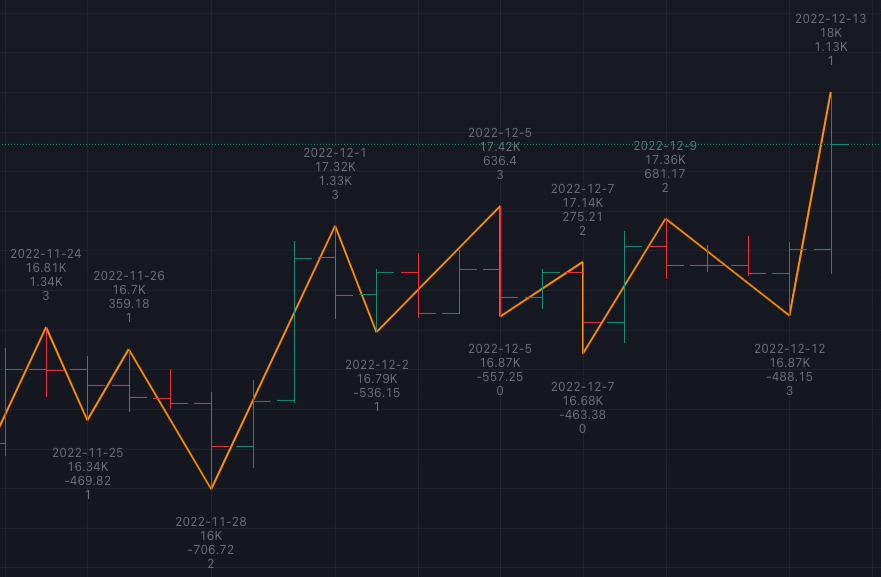
Bar count: This shows the number of bars between swing top/bottom.
WD Gann figured out that in extreme situations, when the market moves for 7 bars or more in one swing direction, the likelihood of a significant price reversal exponentially increases when the swing direction changes state (from UP to DOWN or DOWN to UP)
Data is provided at every swing top/bottom from top to bottom in the order as they are listed in the settings window from left to right.
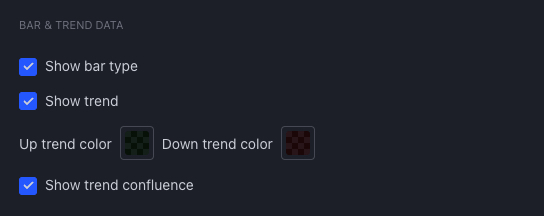
Bar & trend data
Knowing current trends is essential information used for swing traders and investors.
Show bar type enables/disables visual representation of the bar type, up / down / inside / outside. It is provided as a learning tool for the new users based on WD Gann's terminology
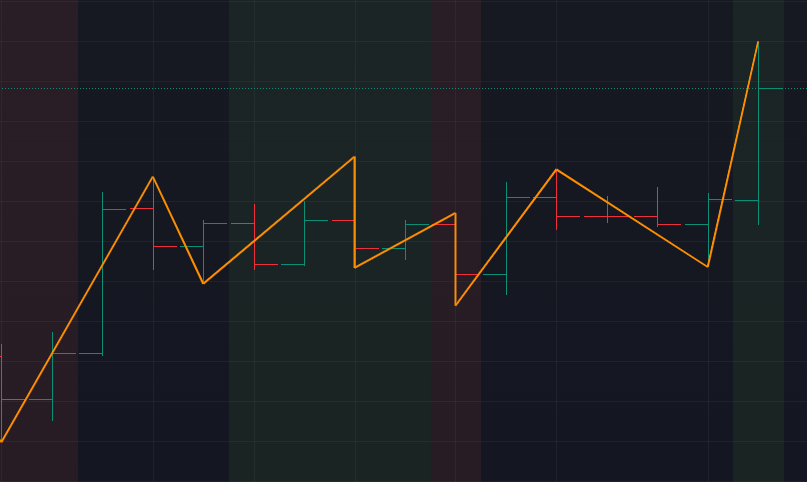
Show trend enables visual representation of trend as background color.
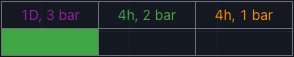
Show trend confluence enables the user to see trend confluence between multiple time frames. This works in conjunction with the creation of additional swings overlays described in the SWING OVERLAY 2 & 3 section above.
Bar types (Up bar = Green up arrow, Down bar = Red down arrow, Outside bar = Blue double arrow, Inside bar = “x”.
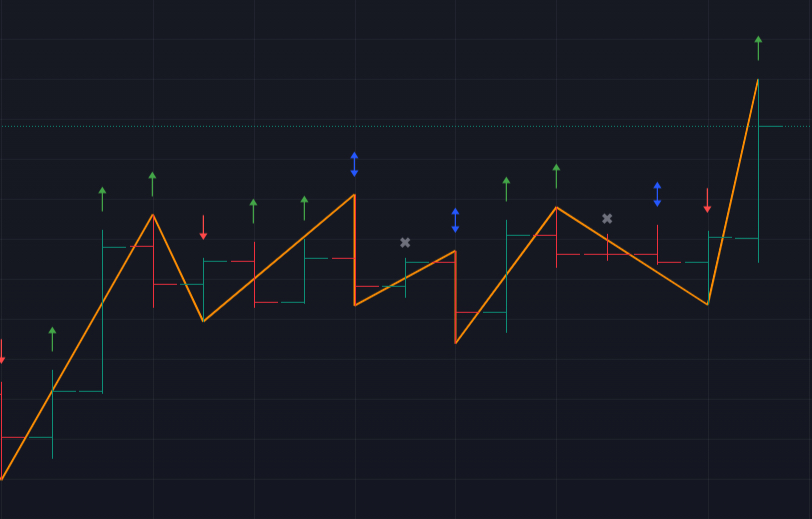
Show Trend - note the background colour on the chart. Up trend default setting is Green, Down trend default setting is Red, Uncertain/Transition in trend has a blank background.
When the trend confluence is enabled, trend confluence table is shown with details about chosen swing type and time frame of every respective swing presented.
Trend Confluence Table
Alerts
This indicator offers different alerts based on the conditions on the chart.
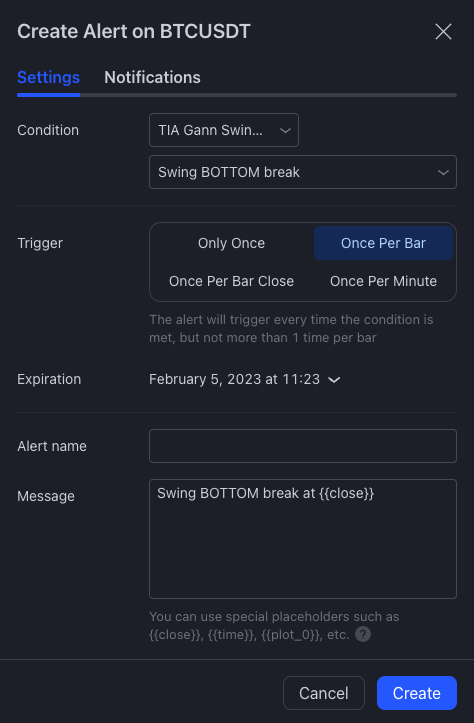
Alert conditions that are available:
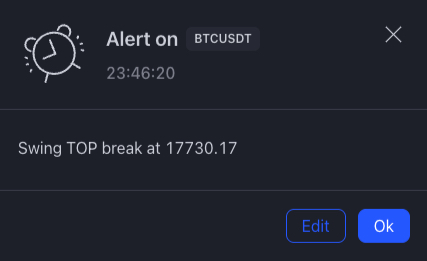
Swing TOP break alerts that the last swing top has been broken.
Swing BOTTOM break alerts that the last swing bottom has been broken.
UP trend alerts that trend has changed to up.
DOWN trend alerts that trend has changed to down.
UNCERTAIN trend alerts that trend has changed to uncertain.
Trigger has to be selected to Once Per Bar.
Every alert contains the price level at which the alert condition has been met.