TIA Gann Swing Indicator
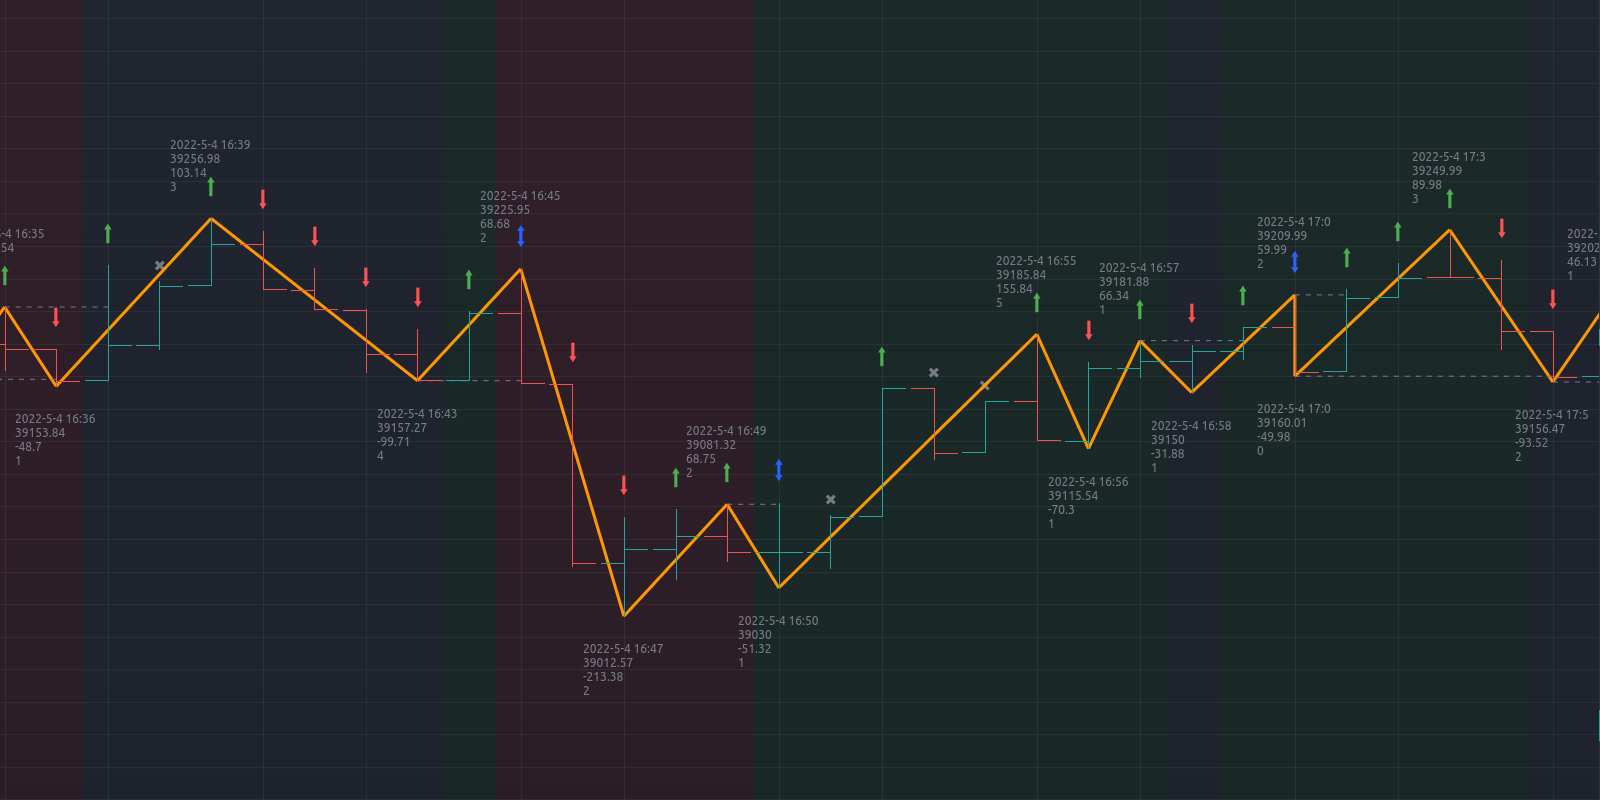
This indicator is a mechanical tool that tells the user exactly what the market trend is at any time, based on the teachings of Legendary trader, Mr. William D. Gann. He called this tool the "Trendline Indicator", but it has popularly become known as the "Swing Chart" by present-day traders.
In October 1909, Richard Wyckoff watched Gann for 25 market days (the markets traded on Saturdays back then), where Gann made 286 trades, both long and short. Two hundred sixty-four (264) of these trades were profits. The Swing Chart was Gann's primary trading tool helping him achieve these phenomenal trading results.
Are you ready?
You are entitled to a 7 days free trial before being charged for the full subscription.
You can cancel at any time before the trial ends and you will not be charged.
3 months
usd
59
total
usd 19.66 per month
Billed every 3 months

7 days free trial
-
Weekly market reports
-
Instant access to TIA Gann Swing Indicator
-
Lifetime access to our Indicator Suite
Best value
1 year
usd
179
total
usd 14.91 per month
|
You save 24%
Billed once a year
-
7 days free trial
-
Weekly market reports
-
Instant access to TIA Gann Swing Indicator
-
Lifetime access to our Indicator Suite
-
For Investors that want the best deal
6 months
usd
99
total
usd 16.50 per month
|
You save 16%
Billed every 6 months
-
7 days free trial
-
Weekly market reports
-
Instant access to TIA Gann Swing Indicator
-
Lifetime access to our Indicator Suite
-
For Investors that want a better deal
This is definitely one of the most profitable tools at your disposal. Because tools are only as good as our reasons and methods for using them we recommend checking the videos available on YouTube.
How to make the most money out of the market
Learn a trading strategy by Michael
Learn a trading strategy by Jason
For more information, we invite you to join the TIA Discord community and continue to the #tia-indicators channel, where you will find indicator-related help, tips, and tricks.